Garden UK data · updated 21 October 2026
UK Gardening Statistics 2026: 100+ sourced figures
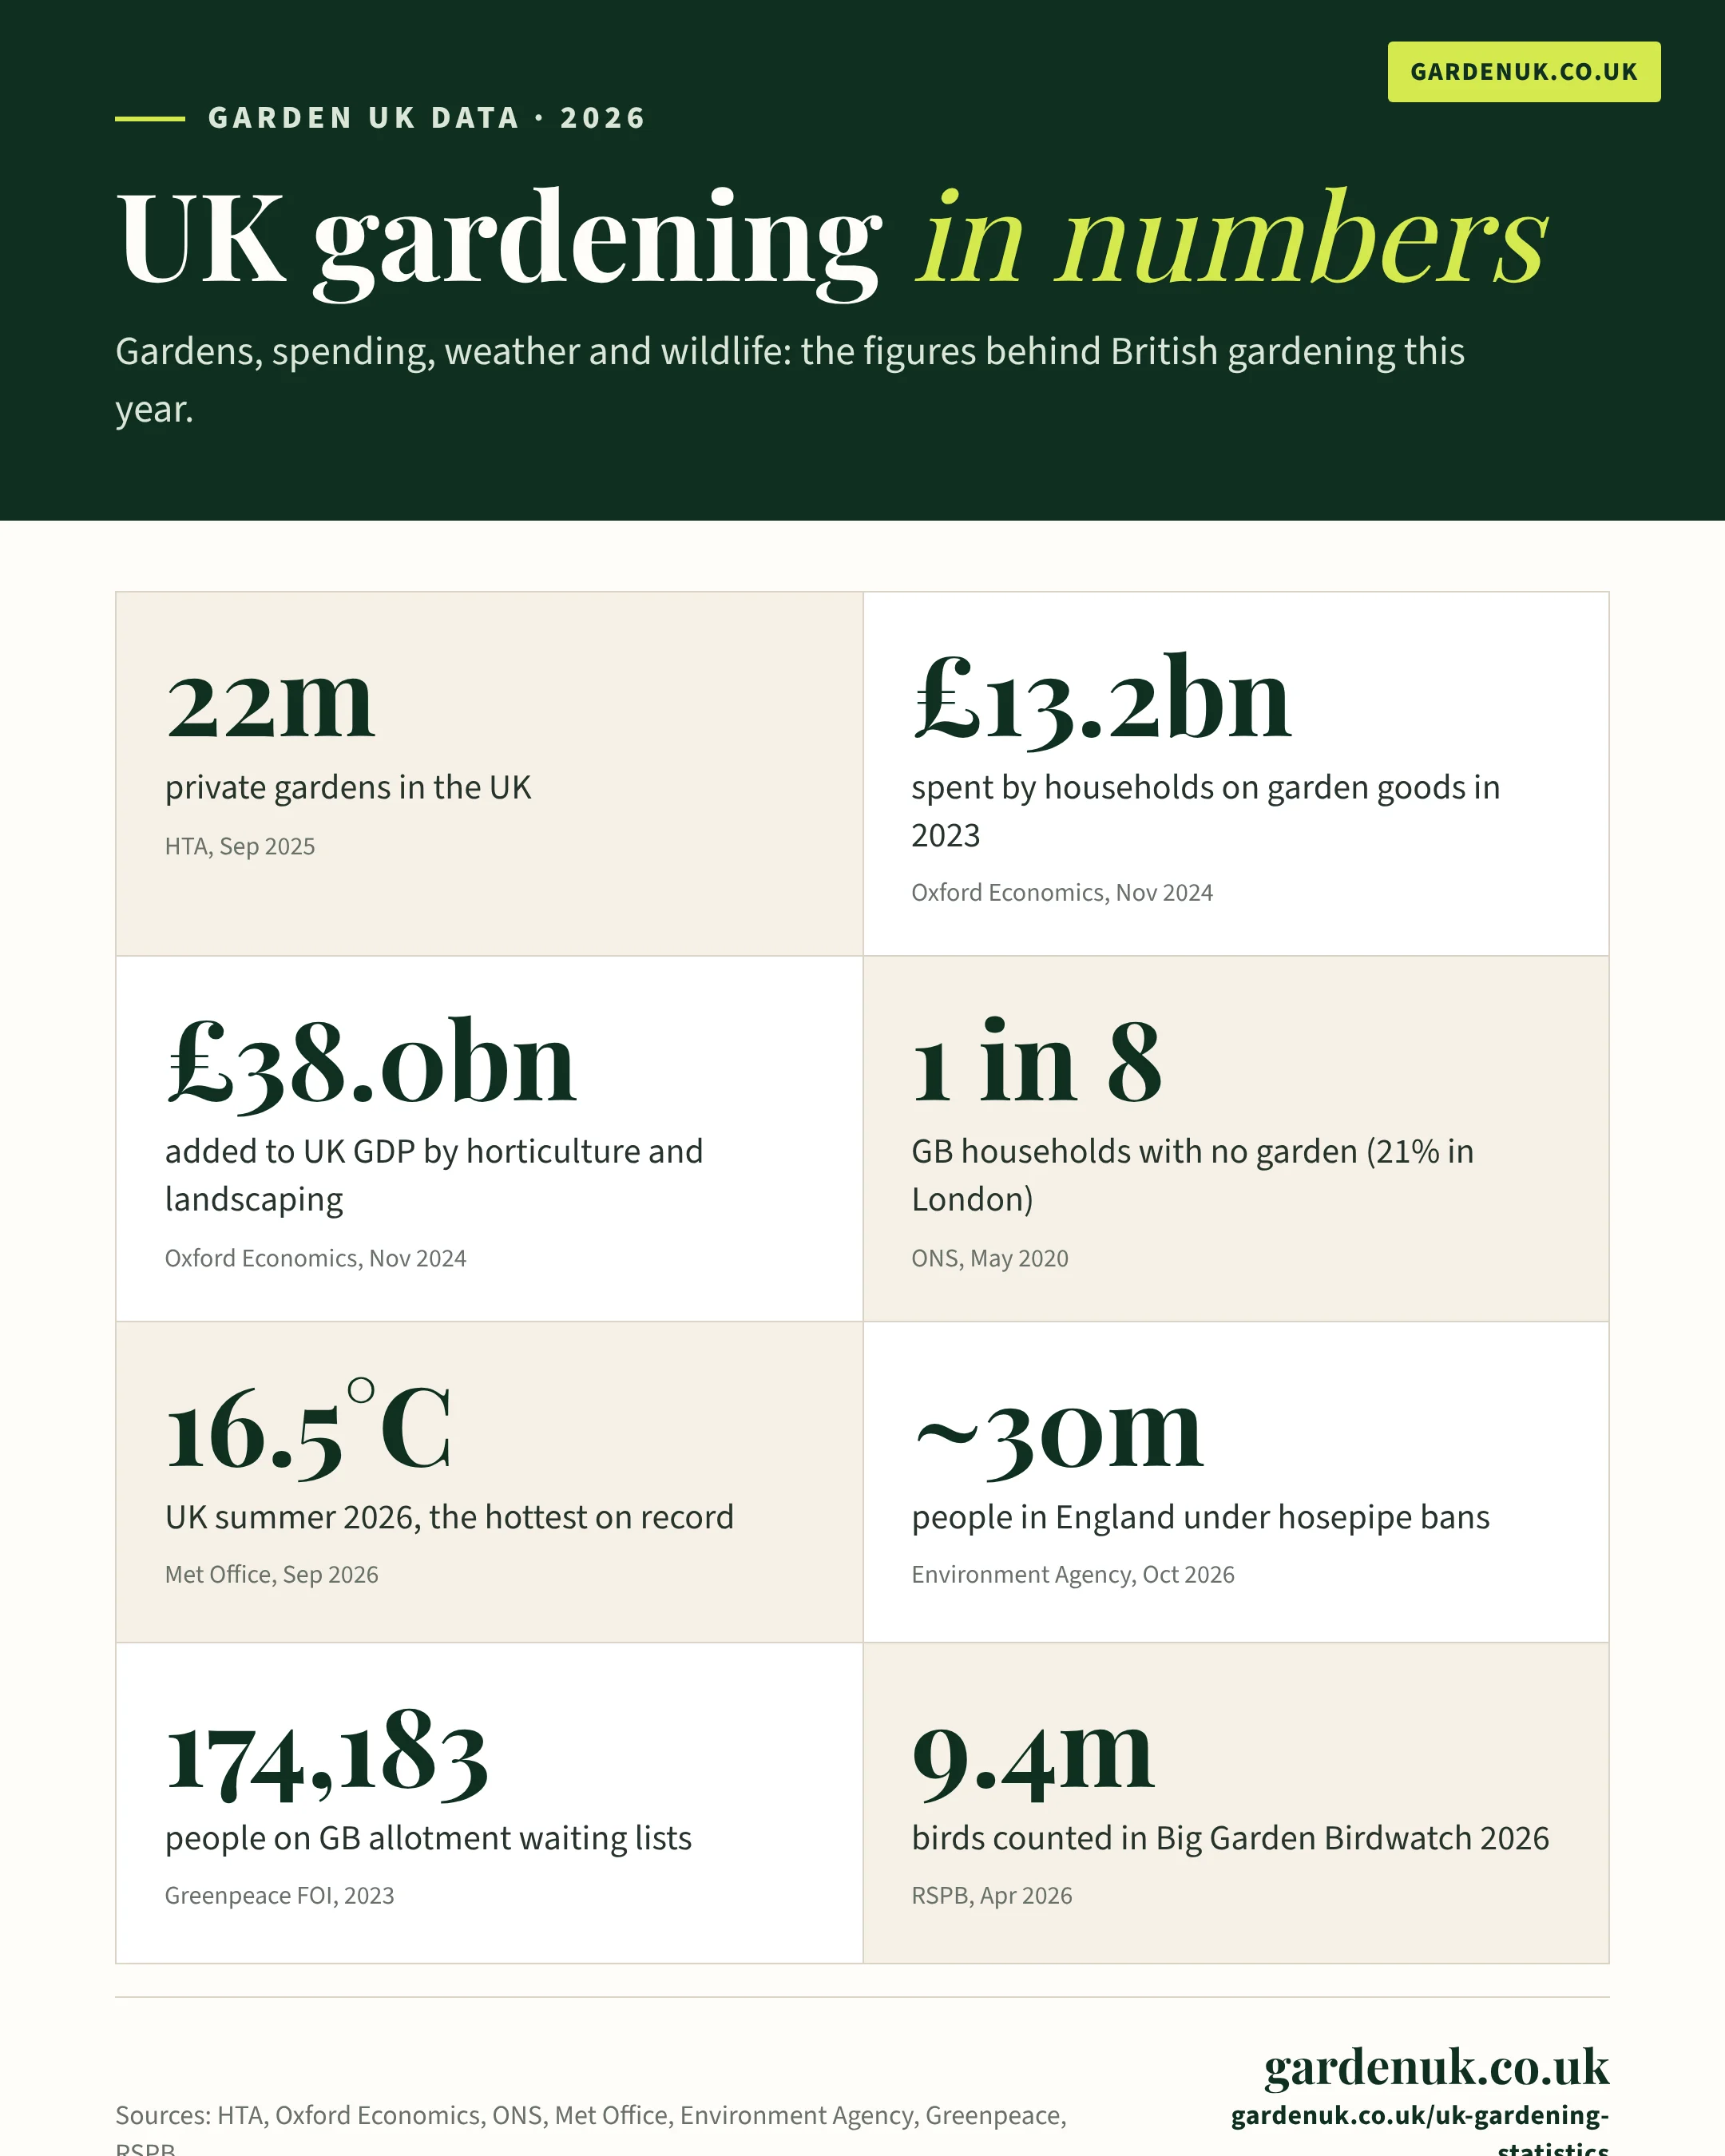
The UK has about 22 million private gardens, and households spent £13.2 billion on garden goods in 2023. In 2026 those gardens came through the hottest summer on record. Around 30 million people in England were still under hosepipe bans in October.
This page brings together official figures from the ONS, Defra, Natural England, the Met Office and the Environment Agency, alongside trade and charity data. Every figure carries its source and date, and you are free to cite it with a link.
Top picks: 16 key UK gardening statistics
Gardens
- 22 million Private gardens in the UK HTA, 25 Sep 2025
- 1 in 8 (12%) GB households with no private or shared garden ONS, 14 May 2020
- 188 m² Median garden size in Great Britain ONS, 14 May 2020
- 76% Adults with garden access who use it at least weekly (England) Natural England, 9 Sep 2026
Money
- £13.2bn Household spend on garden goods, 2023 Oxford Economics for the Environmental Horticulture Group, Nov 2024
- £38.0bn Environmental horticulture contribution to UK GDP, 2023 Oxford Economics for the Environmental Horticulture Group, Nov 2024
- 722,000 Jobs supported by the industry Oxford Economics for the Environmental Horticulture Group, Nov 2024
- £29.22 Average garden centre till spend, August 2026 (inc VAT) HTA, Sep 2026
Weather and water
- 16.5°C UK summer 2026 mean temperature, the highest on record Met Office, 1 Sep 2026
- 64% England summer 2026 rainfall, share of average Met Office, 1 Sep 2026
- ~30 million People under hosepipe bans in England Environment Agency, 2 Oct 2026
- 11 of 14 Environment Agency areas in drought Environment Agency, 16 Oct 2026
Growing and wildlife
- 174,183 People on allotment waiting lists in GB, 2023 Sustain, 23 Oct 2023
- 2,968 Verified allotment sites in the Garden UK finder Garden UK, 30 Sep 2026
- 9.4 million Birds counted in Big Garden Birdwatch 2026 RSPB, 10 Apr 2026
- 85 Yellow-legged hornet nests found in the UK in 2026 National Bee Unit, 15 Oct 2026
How many UK homes have a garden?
Most UK homes have outdoor space, but access is uneven. The HTA estimates there are 22 million private gardens in the UK. The ONS found that one in eight households in Great Britain had no private or shared garden in 2020, rising to 21% in London.
The ONS figure is still the most recent official count for Great Britain. Natural England tracks garden access in England each year. In 2025/26, 9% of adults had no access to a garden or allotment, up from 8% the year before.
| Statistic | Figure | Source (date) |
|---|---|---|
| Private gardens in the UK | 22 million | HTA (25 Sep 2025) |
| Households in Great Britain with no private or shared garden | 12% (1 in 8) | ONS (14 May 2020) |
| Households in London with no garden | 21% | ONS (14 May 2020) |
| Households in Scotland with no garden | 13% | ONS (14 May 2020) |
| Black adults in England with no outdoor space at home | 37% (vs 10% of White adults) | ONS (14 May 2020) |
| Adults in manual or casual work, or unemployed, with no garden | 20% (vs 7% in professional jobs) | ONS (14 May 2020) |
| Median garden size, Great Britain | 188 m² | ONS (14 May 2020) |
| Median garden size, London | 140 m² | ONS (14 May 2020) |
| Median garden size, Scotland | 226 m² | ONS (14 May 2020) |
| Adults in England with no garden or allotment access, 2025/26 | 9% (8% in 2024/25) | Natural England (9 Sep 2026) |
| Adults with garden access who spend time in it at least weekly, 2025/26 | 76% | Natural England (9 Sep 2026) |
| People in Great Britain within a 5-minute walk of a public park | 28% | ONS (14 May 2020) |
How many people garden in the UK, and why?
The HTA puts the number of people who enjoy gardening at 30 million. Health is a large part of the appeal. 85% of UK adults say gardens benefit their mental state, and eight in ten say they help their physical health.
Natural England data points the same way. 89% of adults who had recently visited green space agreed that time outdoors is good for their mental health.
| Statistic | Figure | Source (date) |
|---|---|---|
| People in the UK who enjoy gardening | 30 million | HTA (25 Sep 2025) |
| UK adults who say gardens benefit their mental state | 85% | HTA (25 Sep 2025) |
| UK adults who say gardens benefit their physical health | 8 in 10 | HTA (25 Sep 2025) |
| Lower dementia risk linked to daily gardening in older adults | 36% | HTA (25 Sep 2025) |
| Adults in England who visited green or natural space in the last 14 days, 2025/26 | 68% | Natural England (9 Sep 2026) |
| Adults who agree time outdoors is good for mental health, 2025/26 | 89% | Natural England (9 Sep 2026) |
| Adults who say being in nature makes them very happy, 2025/26 | 84% | Natural England (9 Sep 2026) |
| Adults who feel part of nature, 2025/26 | 67% (62% in 2024/25) | Natural England (9 Sep 2026) |
How much do UK households spend on their gardens?
UK households spent £13.2 billion on garden goods in 2023, according to Oxford Economics. They spent a further £5.8 billion on professional gardening and landscaping services.
Garden size drives spending. The HTA estimates that each extra square metre of garden brings £2.01 of spending on plants and products a year.
| Statistic | Figure | Source (date) |
|---|---|---|
| Household spend on garden goods, 2023 | £13.2bn | Oxford Economics for the Environmental Horticulture Group (Nov 2024) |
| Household spend on professional gardening and landscaping, 2023 | £5.8bn | Oxford Economics for the Environmental Horticulture Group (Nov 2024) |
| Annual spend on plants and products per extra m² of garden | £2.01 | HTA (25 Sep 2025) |
| Spending unlocked over a century by 200 m² gardens on new homes | £64.7bn | HTA (25 Sep 2025) |
| Average garden centre transaction, August 2026 | £24.84 ex VAT (£29.22 inc VAT) | HTA (Sep 2026) |
| Average garden centre café transaction, August 2026 | £12.24 ex VAT (£14.62 inc VAT) | HTA (Sep 2026) |
How big is the UK garden and horticulture industry?
Environmental horticulture and landscaping added £38.0 billion to UK GDP in 2023. That is £1 in every £71 of the economy. The figure includes garden tourism and the knock-on spending of suppliers and staff.
The direct contribution, before those knock-on effects, was £16.3 billion. Defra values UK ornamental plant production at £1.6 billion in 2025.
| Statistic | Figure | Source (date) |
|---|---|---|
| Total contribution to UK GDP, 2023 | £38.0bn (£1 in every £71) | Oxford Economics for the Environmental Horticulture Group (Nov 2024) |
| Direct contribution to UK GDP, 2023 | £16.3bn | Oxford Economics for the Environmental Horticulture Group (Nov 2024) |
| Total jobs supported | 722,000 | Oxford Economics for the Environmental Horticulture Group (Nov 2024) |
| Direct jobs | 417,000 | Oxford Economics for the Environmental Horticulture Group (Nov 2024) |
| Total tax revenue generated | £8.5bn | Oxford Economics for the Environmental Horticulture Group (Nov 2024) |
| England: total GDP / total jobs (excl. tourism) | £25.9bn / 490,000 | Oxford Economics for the Environmental Horticulture Group (Nov 2024) |
| Scotland: total GDP / total jobs (excl. tourism) | £2.6bn / 59,700 | Oxford Economics for the Environmental Horticulture Group (Nov 2024) |
| Wales: total GDP / total jobs (excl. tourism) | £1.8bn / 37,000 | Oxford Economics for the Environmental Horticulture Group (Nov 2024) |
| Northern Ireland: total GDP / total jobs (excl. tourism) | £1.4bn / 22,400 | Oxford Economics for the Environmental Horticulture Group (Nov 2024) |
| Value of UK ornamental plant production, 2025 | £1.6bn (down 2.0%) | Defra (25 Jun 2026) |
How are garden centre sales doing in 2026?
Garden centres are selling more coffee and fewer plants. In August 2026, gardening sales fell 7% by value on August 2025, while café sales rose 10%. Gardening made up about half of sales, down from 59% in June.
The heat and hosepipe bans hit plants hardest. Hardy plants, shrubs and trees fell 14% and bedding plants fell 11%. Seeds rose 6%.
| Statistic | Figure | Source (date) |
|---|---|---|
| Overall sales incl. catering, Jan to Aug 2026 vs 2025 | +2% | HTA (Sep 2026) |
| Gardening sales, Jan to Aug 2026 vs 2025 | -2% | HTA (Sep 2026) |
| Gardening sales, August 2026 vs August 2025 | -7% | HTA (Sep 2026) |
| Café and restaurant sales, August 2026 | +10% | HTA (Sep 2026) |
| Hardy plants, shrubs and trees, August 2026 | -14% | HTA (Sep 2026) |
| Bedding and other plants, August 2026 | -11% | HTA (Sep 2026) |
| Plant care products, August 2026 | -14% | HTA (Sep 2026) |
| Seeds (excl. grass seed), August 2026 | +6% (+9% year to date) | HTA (Sep 2026) |
| Bulbs, year to date 2026 | +9% | HTA (Sep 2026) |
| Indoor plants, August 2026 | +2% | HTA (Sep 2026) |
| Gardening share of garden centre sales, Aug 2026 | ~50% (59% in June) | HTA (Sep 2026) |
| Live plants, bulbs and seeds share of sales, Aug 2026 | 22% (24% in Aug 2025) | HTA (Sep 2026) |
How hot and dry was summer 2026 for UK gardens?
Summer 2026 was the UK's hottest on record. The mean temperature was 16.5°C, beating the record set only a year earlier. England had just 64% of its usual summer rain and Wales had 59%.
The peak was 38.2°C at Hartpury College on 13 August. July was England's driest on record.
| Statistic | Figure | Source (date) |
|---|---|---|
| UK summer mean temperature, 2026 | 16.5°C (+1.9°C on 1991-2020) | Met Office (1 Sep 2026) |
| Previous record, summer 2025 | 16.1°C | Met Office (1 Sep 2026) |
| England summer mean temperature | 18.2°C (+2.5°C) | Met Office (1 Sep 2026) |
| Highest temperature of summer 2026 | 38.2°C, Hartpury College, 13 Aug | Met Office (1 Sep 2026) |
| Met Office stations that broke all-time maximum records | 54 | Met Office (1 Sep 2026) |
| UK summer rainfall | 195.4 mm (77% of average) | Met Office (1 Sep 2026) |
| England summer rainfall | 132.9 mm (64%) | Met Office (1 Sep 2026) |
| Wales summer rainfall | 179.5 mm (59%) | Met Office (1 Sep 2026) |
| Scotland summer rainfall | 295.0 mm (93%) | Met Office (1 Sep 2026) |
| Northern Ireland summer rainfall | 246.8 mm (91%) | Met Office (1 Sep 2026) |
| England summer sunshine | 752.2 hours (133%, 2nd sunniest) | Met Office (1 Sep 2026) |
| How much more likely climate change made the summer | About 130 times | Met Office (1 Sep 2026) |

Which areas have hosepipe bans and drought in 2026?
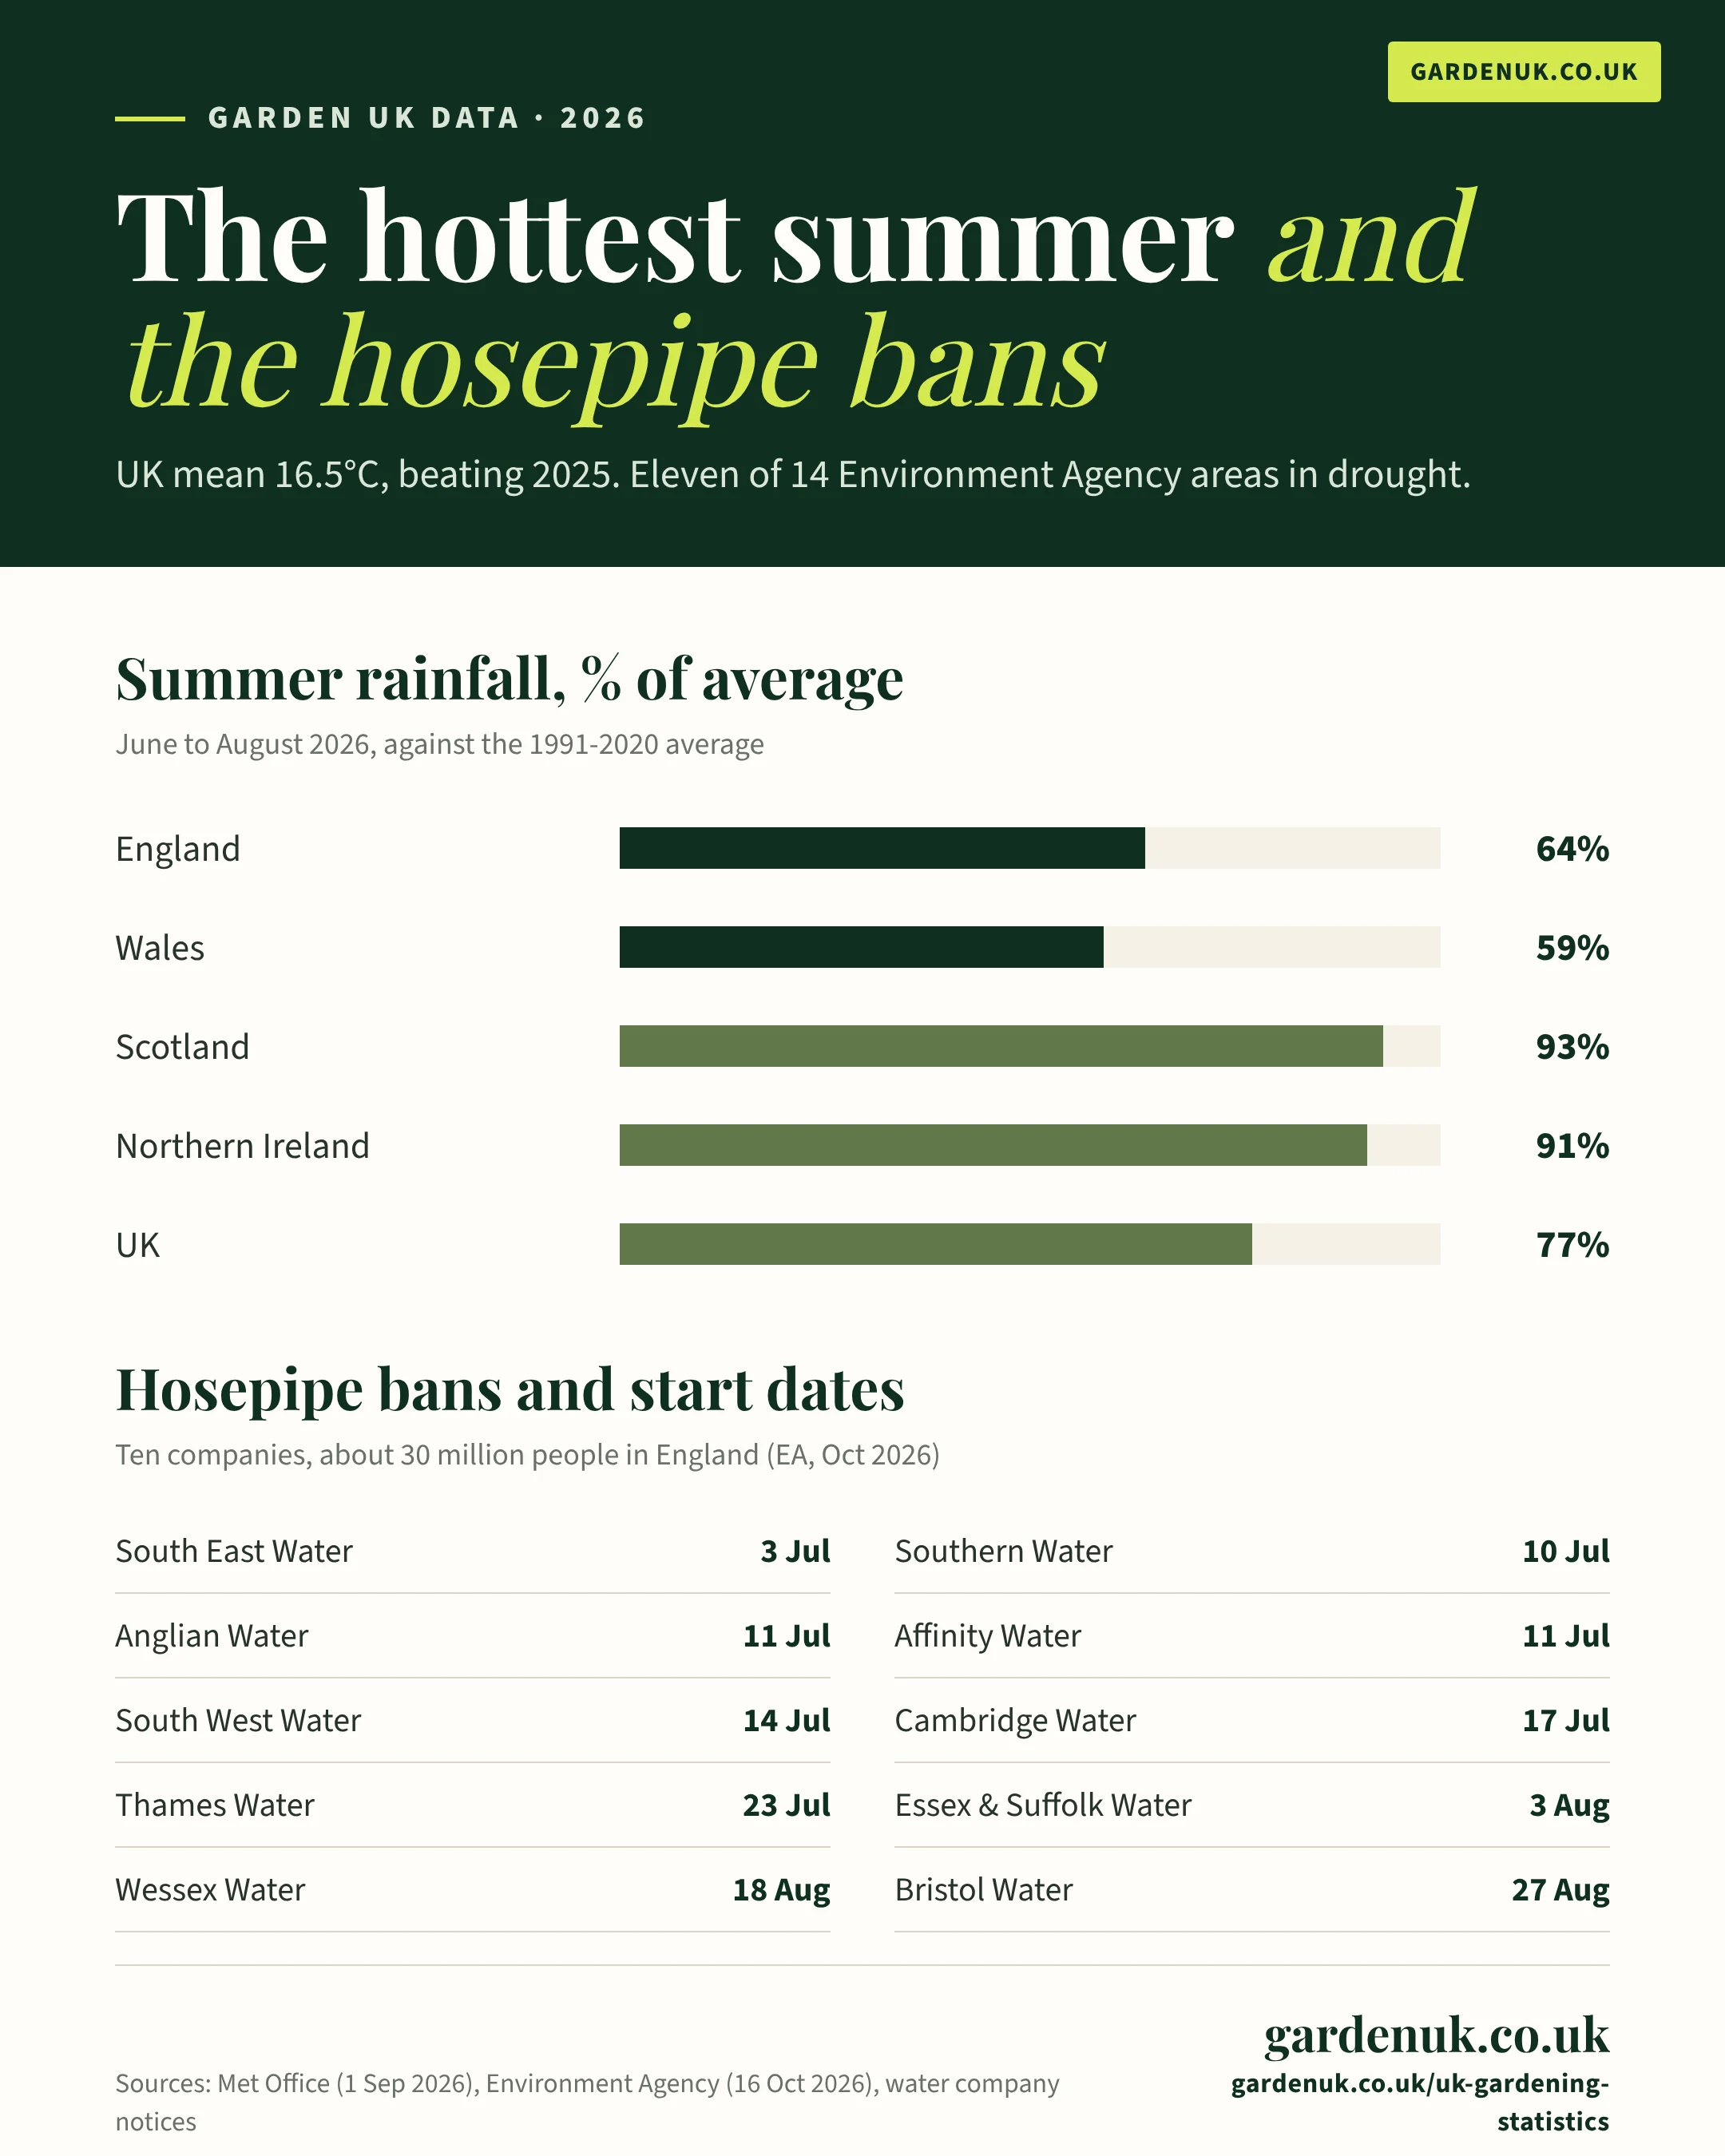
Ten water companies in England had hosepipe bans in force in mid-October 2026. The Environment Agency puts the number of people affected at around 30 million. Eleven of its 14 areas are in drought, and four have parts in severe drought.
Reservoirs in England were 54% full in mid-October, about 21% below normal for the time of year. The National Drought Group says 120% of typical rainfall is needed over the next seven months for every area to leave drought.
| Statistic | Figure | Source (date) |
|---|---|---|
| People affected by hosepipe bans in England | ~30 million | Environment Agency (2 Oct 2026) |
| Water companies with a ban in force, mid-October 2026 | 10 (plus 8 smaller NAV suppliers) | Environment Agency (16 Oct 2026) |
| Environment Agency areas in drought | 11 of 14 | Environment Agency (16 Oct 2026) |
| Areas with parts in severe drought | 4 (Wessex; Devon and Cornwall; Solent and South Downs; Kent and South London) | Environment Agency (16 Oct 2026) |
| England reservoir storage, week to 13 Oct 2026 | 54% (about 21% below normal) | Environment Agency (16 Oct 2026) |
| October rainfall so far, England | 26% of average | Environment Agency (16 Oct 2026) |
| Rainfall needed over the next seven months to end drought | 120% of typical | Defra and Environment Agency (16 Sep 2026) |
| Water demand rise on the hottest days | Up to 30% | Defra and Environment Agency (16 Sep 2026) |
| Chance around half of England is still in drought next spring | About 1 in 4 | Defra and Environment Agency (16 Sep 2026) |
Hosepipe bans by water company, 2026
| Water company | Ban started | People covered |
|---|---|---|
| South East Water | 3 Jul 2026 (Kent); 25 Jul (whole area) | ~2.4 million |
| Southern Water | 10 Jul 2026 (Hampshire and Isle of Wight) | ~1 million |
| Anglian Water | 11 Jul 2026 | 5 million+ |
| Affinity Water | 11 Jul 2026 (Central); 17 Aug (East) | ~3.9 million |
| South West Water | 14 Jul 2026 (Mid and East Devon); 8 Aug (whole area) | Not published |
| Cambridge Water | 17 Jul 2026 | ~350,000 |
| Thames Water | 23 Jul 2026 | ~15 million |
| Essex and Suffolk Water | 3 Aug 2026 | ~2 million |
| Wessex Water | 18 Aug 2026 | ~1.4 million |
| Bristol Water | 27 Aug 2026 | ~1.2 million |
Start dates and customer numbers come from company notices, compiled by Water Industry Hub (October 2026). Company areas overlap, so the customer numbers should not be added together. The Environment Agency's figure of about 30 million is the better total. Welsh Water's ban, covering about 33,000 properties, was lifted on 4 September 2026.
How long are allotment waiting lists in the UK?
There is no official national count of allotment waiting lists. Freedom of information studies fill the gap. Greenpeace-backed research found 174,183 people waiting across England, Scotland and Wales in 2023, almost double the 2011 level.
Most waits run from 18 months to 4 years, depending on where you live and local demand. In APSE's 2025 survey of councils, 63% reported waits of more than 18 months. A 2025 FOI study of 175 councils put the average at about four years, with Haringey and West Dunbartonshire longest at nine years.
| Statistic | Figure | Source (date) |
|---|---|---|
| People on allotment waiting lists, England, Scotland and Wales, 2023 | 174,183 | Sustain (23 Oct 2023) |
| Change since 2011 | Almost doubled | Sustain (23 Oct 2023) |
| Typical wait for an allotment, 2025 | 18 months to 4 years, depending on area | APSE (Association for Public Service Excellence) (Aug 2025) |
| Councils reporting waits of more than 18 months, 2025 | 63% (49% in 2019) | APSE (Association for Public Service Excellence) (Aug 2025) |
| Councils with more than 1,000 people on their list, 2025 | 31% | APSE (Association for Public Service Excellence) (Aug 2025) |
| Councils that have cut plot sizes to shorten lists, 2025 | 76% | APSE (Association for Public Service Excellence) (Aug 2025) |
| Councils limiting tenants to one plot per person or household, 2025 | 55% | APSE (Association for Public Service Excellence) (Aug 2025) |
| People on waiting lists at 175 responding councils, May 2025 | 108,958 | Dino Decking (14 Jul 2025) |
| Average wait, May 2025 | About 4 years | Dino Decking (14 Jul 2025) |
| Longest average waits | 9 years (Haringey; West Dunbartonshire) | Dino Decking (14 Jul 2025) |
| Largest council list | 7,420 (Portsmouth) | Dino Decking (14 Jul 2025) |
| Next largest lists | Edinburgh 6,846; Bristol 6,466; Lewisham 3,918; Wakefield 3,687 | Dino Decking (14 Jul 2025) |
| Region with the most people waiting | South East England, 20,901 | Dino Decking (14 Jul 2025) |

Garden UK owned data
Which regions have the most allotment sites?
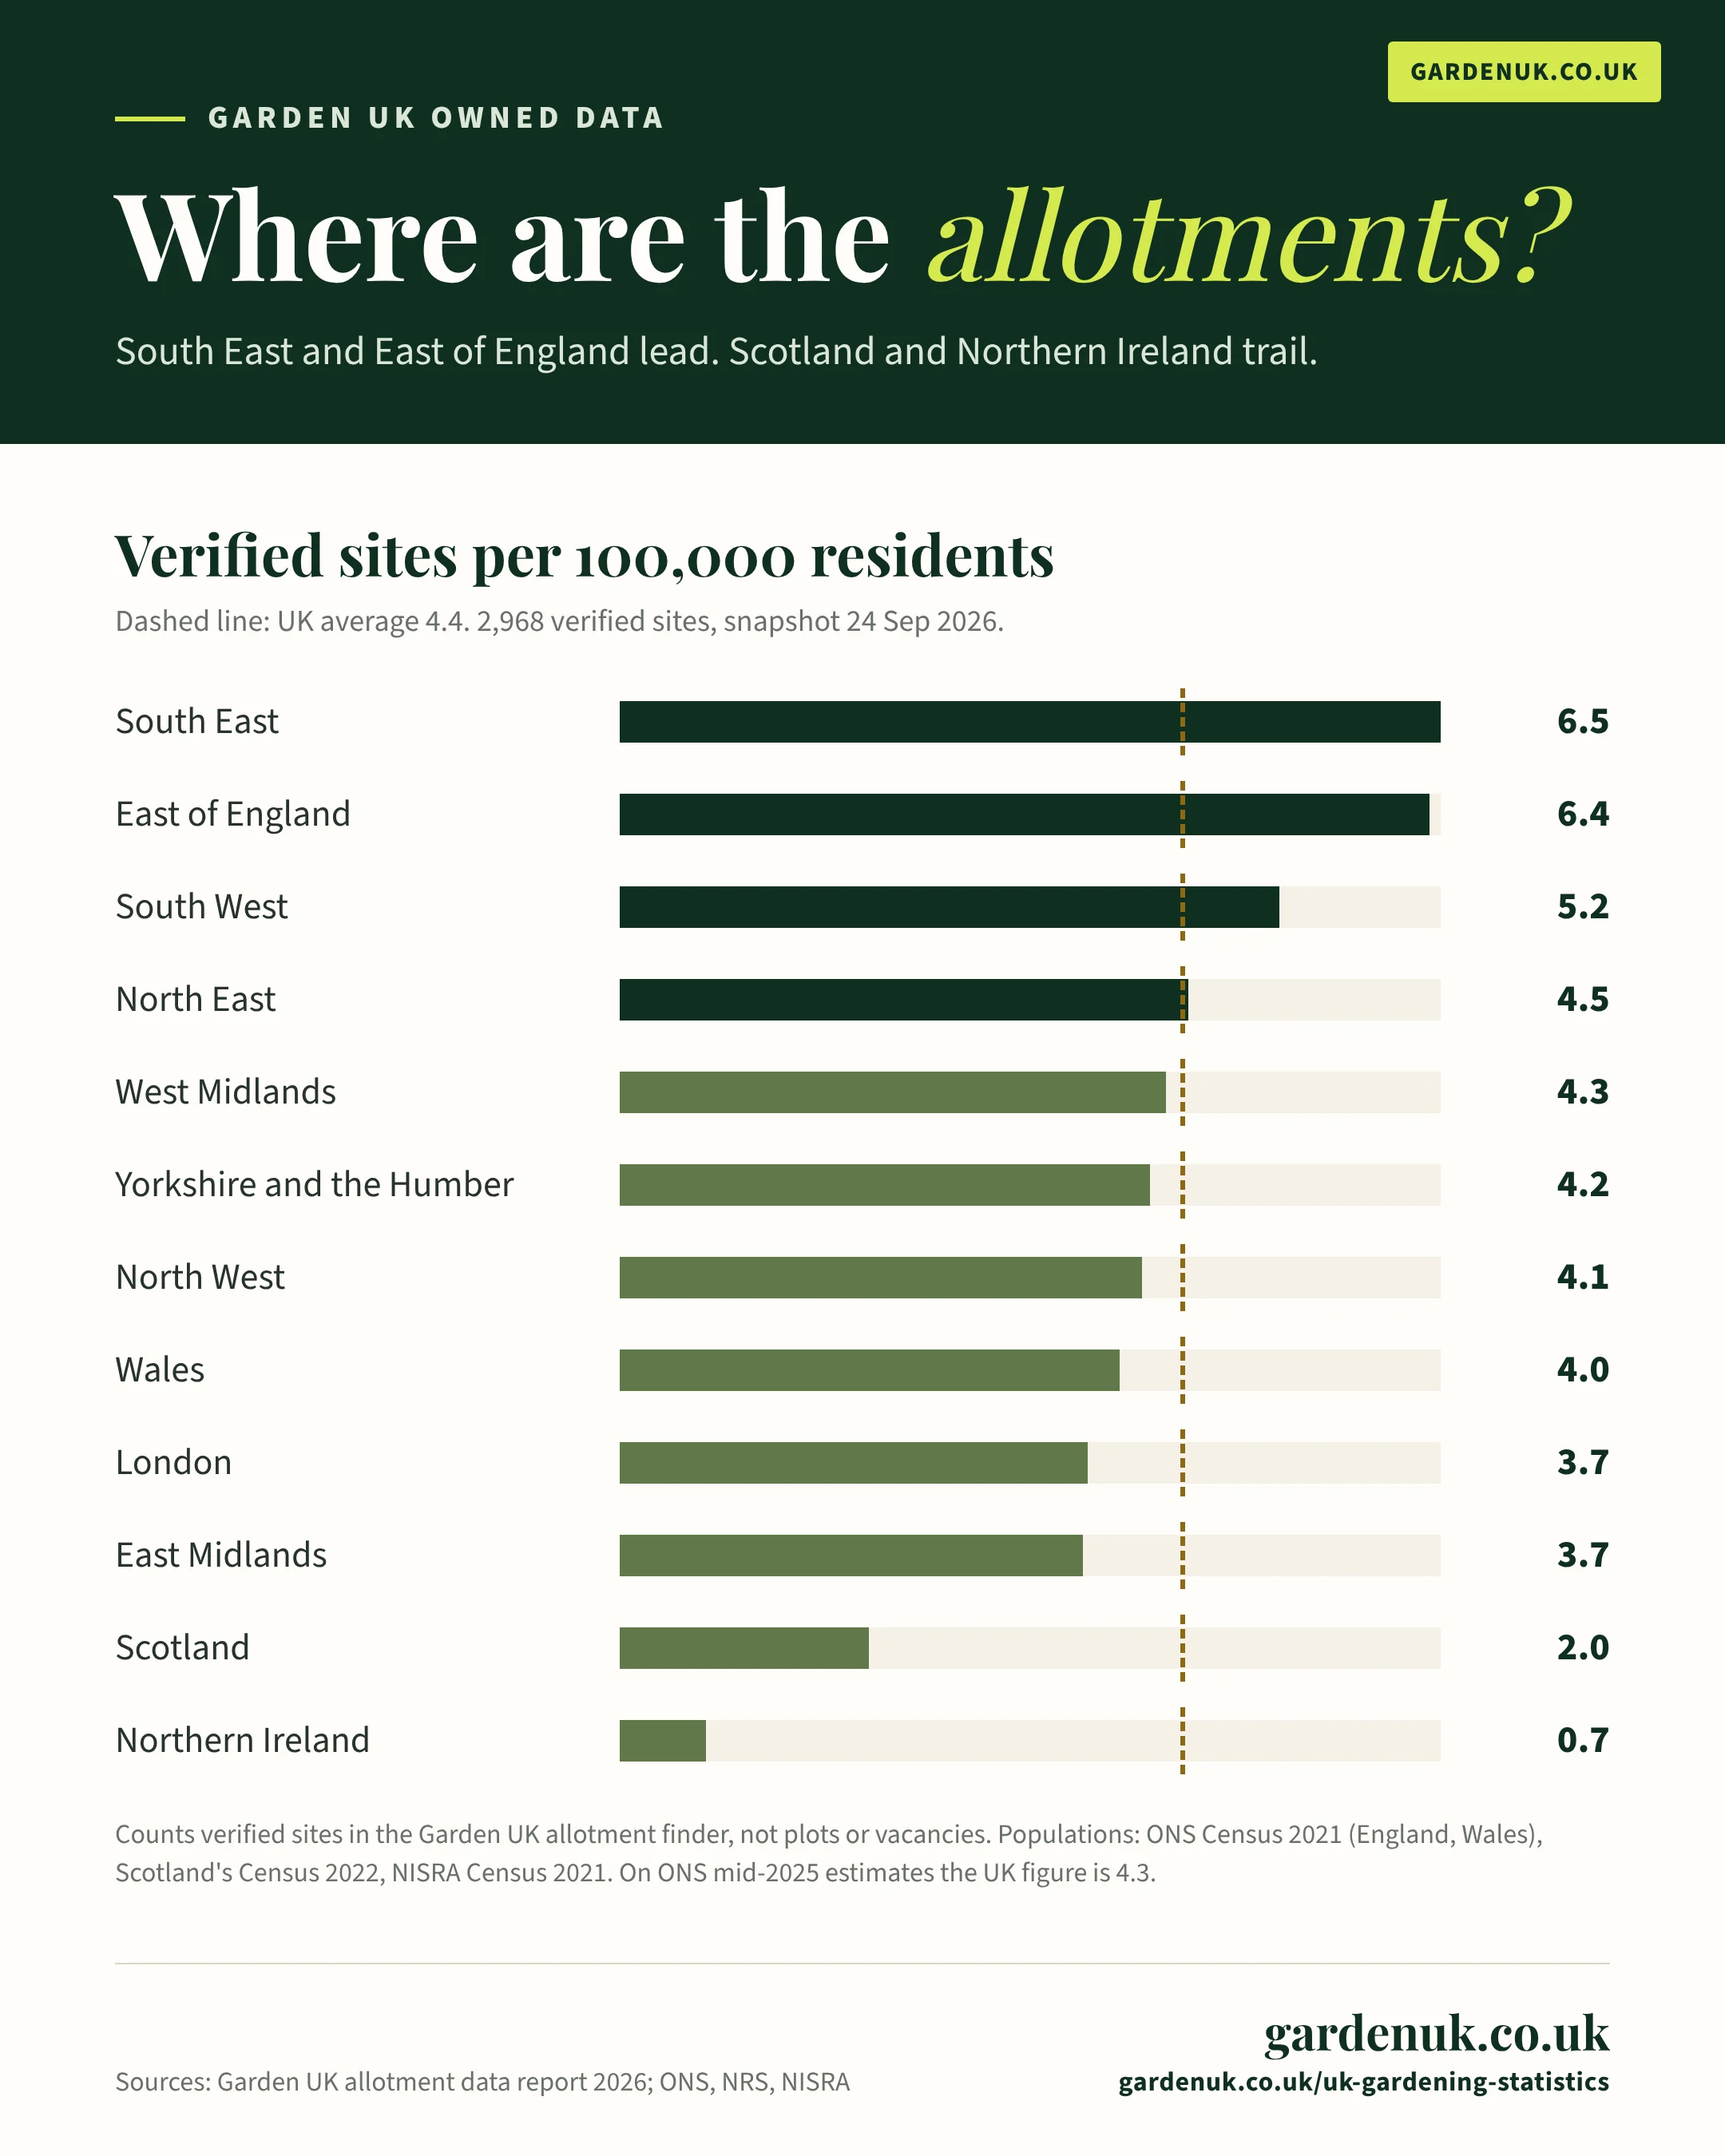
Garden UK checked 15,058 mapped allotment candidates and kept 2,968 verified sites in its allotment finder (snapshot 24 September 2026). Against the latest ONS population estimate (mid-2025), that is 4.3 verified sites per 100,000 residents across the UK.
South East England and the East of England have the most verified sites per head. London sits below the UK average despite some of the longest waiting lists. Scotland and Northern Ireland have the fewest per head in our data, partly because mapped allotment records are thinner there.
By nation (ONS mid-2025 populations)
| Nation | Verified sites | Population, mid-2025 | Sites per 100,000 residents |
|---|---|---|---|
| England | 2,725 | 58,834,800 | 4.6 |
| Wales | 123 | 3,175,200 | 3.9 |
| Scotland | 107 | 5,545,500 | 1.9 |
| Northern Ireland | 13 | 1,928,400 | 0.7 |
| United Kingdom | 2,968 | 69,483,900 | 4.3 |
Sources: Garden UK allotment data report (30 Sep 2026); ONS mid-2025 population estimates (1 Oct 2026).
By region (census populations)
| Region | Verified sites | Share of UK total | Sites per 100,000 residents |
|---|---|---|---|
| South East England | 603 | 20.3% | 6.5 |
| East of England | 406 | 13.7% | 6.4 |
| South West England | 298 | 10.0% | 5.2 |
| North East England | 119 | 4.0% | 4.5 |
| West Midlands | 257 | 8.7% | 4.3 |
| Yorkshire and the Humber | 230 | 7.7% | 4.2 |
| North West England | 307 | 10.3% | 4.1 |
| Wales | 123 | 4.1% | 4.0 |
| London | 326 | 11.0% | 3.7 |
| East Midlands | 179 | 6.0% | 3.7 |
| Scotland | 107 | 3.6% | 2.0 |
| Northern Ireland | 13 | 0.4% | 0.7 |
| United Kingdom (census basis) | 2,968 | 100% | 4.4 |
What this measures: verified allotment sites in the Garden UK finder, not plots or vacancies. One site can hold many plots, and many real sites are not yet verified, so this is a lower bound on provision. Regional figures use census counts, the most recent complete count for every region and nation: ONS Census 2021 for English regions and Wales, Scotland's Census 2022 and NISRA Census 2021. Garden UK's regions follow ONS regions closely but are not identical. Full method: UK allotment data report 2026.
How much fruit and veg does the UK grow?
UK growers produced 2.6 million tonnes of vegetables in 2025, worth £2.1 billion. That covered 56% of the vegetables the country uses. Fruit is a different story: home production met only 14% of supply.
These are commercial figures. They show how much of a typical shopping basket a home grower could replace.
| Statistic | Figure | Source (date) |
|---|---|---|
| Value of home-produced vegetables, 2025 | £2,117m (+0.4%) | Defra (25 Jun 2026) |
| Vegetable production, 2025 | 2.6 million tonnes (+8.0%) | Defra (25 Jun 2026) |
| Vegetable self-sufficiency, 2025 | 56% (54% in 2024) | Defra (25 Jun 2026) |
| Value of field vegetables | £1,686m | Defra (25 Jun 2026) |
| Value of protected (glasshouse) vegetables | £431m | Defra (25 Jun 2026) |
| Value of home-produced fruit, 2025 | £1,137m (+5.0%) | Defra (25 Jun 2026) |
| Fruit production, 2025 | 577,000 tonnes (+2.3%) | Defra (25 Jun 2026) |
| Fruit self-sufficiency, 2025 | 14% (15% in 2024) | Defra (25 Jun 2026) |
How are garden birds and wildlife doing?
Gardens are a major wildlife survey site. 650,279 people counted more than 9 million birds in the RSPB's Big Garden Birdwatch 2026. The house sparrow kept the top spot. The greenfinch fell to 18th and is now on the UK Red List.
About a third of English adults with outdoor space do something to help wildlife. Almost all of them feed birds.
| Statistic | Figure | Source (date) |
|---|---|---|
| Big Garden Birdwatch 2026 participants | 650,279 | RSPB (10 Apr 2026) |
| Birds counted | 9.4 million | RSPB (10 Apr 2026) |
| Top five species, 2026 | House sparrow, blue tit, starling, woodpigeon, blackbird | RSPB (10 Apr 2026) |
| Greenfinch ranking, 2026 | 18th (Red List) | RSPB (10 Apr 2026) |
| Greenfinch decline over three decades | Over 65% | RSPB (10 Apr 2026) |
| Adults with outdoor space encouraging wildlife, England, 2024 | 34% | Defra (Dec 2024) |
| Of those, share feeding birds and other wild animals | 97% | Defra (Dec 2024) |
| Of those, share growing pollinator-friendly plants | 90% | Defra (Dec 2024) |
| Yellow-legged hornet sightings, UK, 2026 to 15 Oct | 226 | National Bee Unit (15 Oct 2026) |
| Yellow-legged hornet nests found, UK, 2026 to 15 Oct | 85 | National Bee Unit (15 Oct 2026) |
| Yellow-legged hornet sightings and nests, full year 2025 | 544 sightings, 161 nests | GB Non-native Species Secretariat (21 Nov 2025) |
What happened to the peat ban for gardeners?
The UK Government said in 2022 that it would ban retail sales of peat for amateur gardeners by 2024. That deadline passed with no law in any of the four UK nations. 95.5% of people who answered Defra's 2021 consultation backed a retail ban.
Peat use has fallen slowly. UK growing media contained 2.76 million cubic metres of peat in 2011 and 2.06 million in 2019, a drop of about 25%.
| Statistic | Figure | Source (date) |
|---|---|---|
| Original voluntary target for peat-free amateur gardening | 2020 (missed) | Peat Free Partnership (Jan 2025 entry) |
| Promised retail ban date | 2024 (no law passed by Jan 2025) | Peat Free Partnership (Jan 2025 entry) |
| Consultation respondents backing a retail ban, 2021 | 95.5% | Peat Free Partnership (Jan 2025 entry) |
| Peat in UK growing media, 2011 | 2.76 million m³ | Peat Free Partnership (Jan 2025 entry) |
| Peat in UK growing media, 2019 | 2.06 million m³ | Peat Free Partnership (Jan 2025 entry) |
| Horticultural products that were peat-free, 2011 | 32% | Peat Free Partnership (Jan 2025 entry) |
| Houseplants sold in UK garden centres that are imported | 87% | HTA (2023) |
UK gardening statistics 2026: the infographic
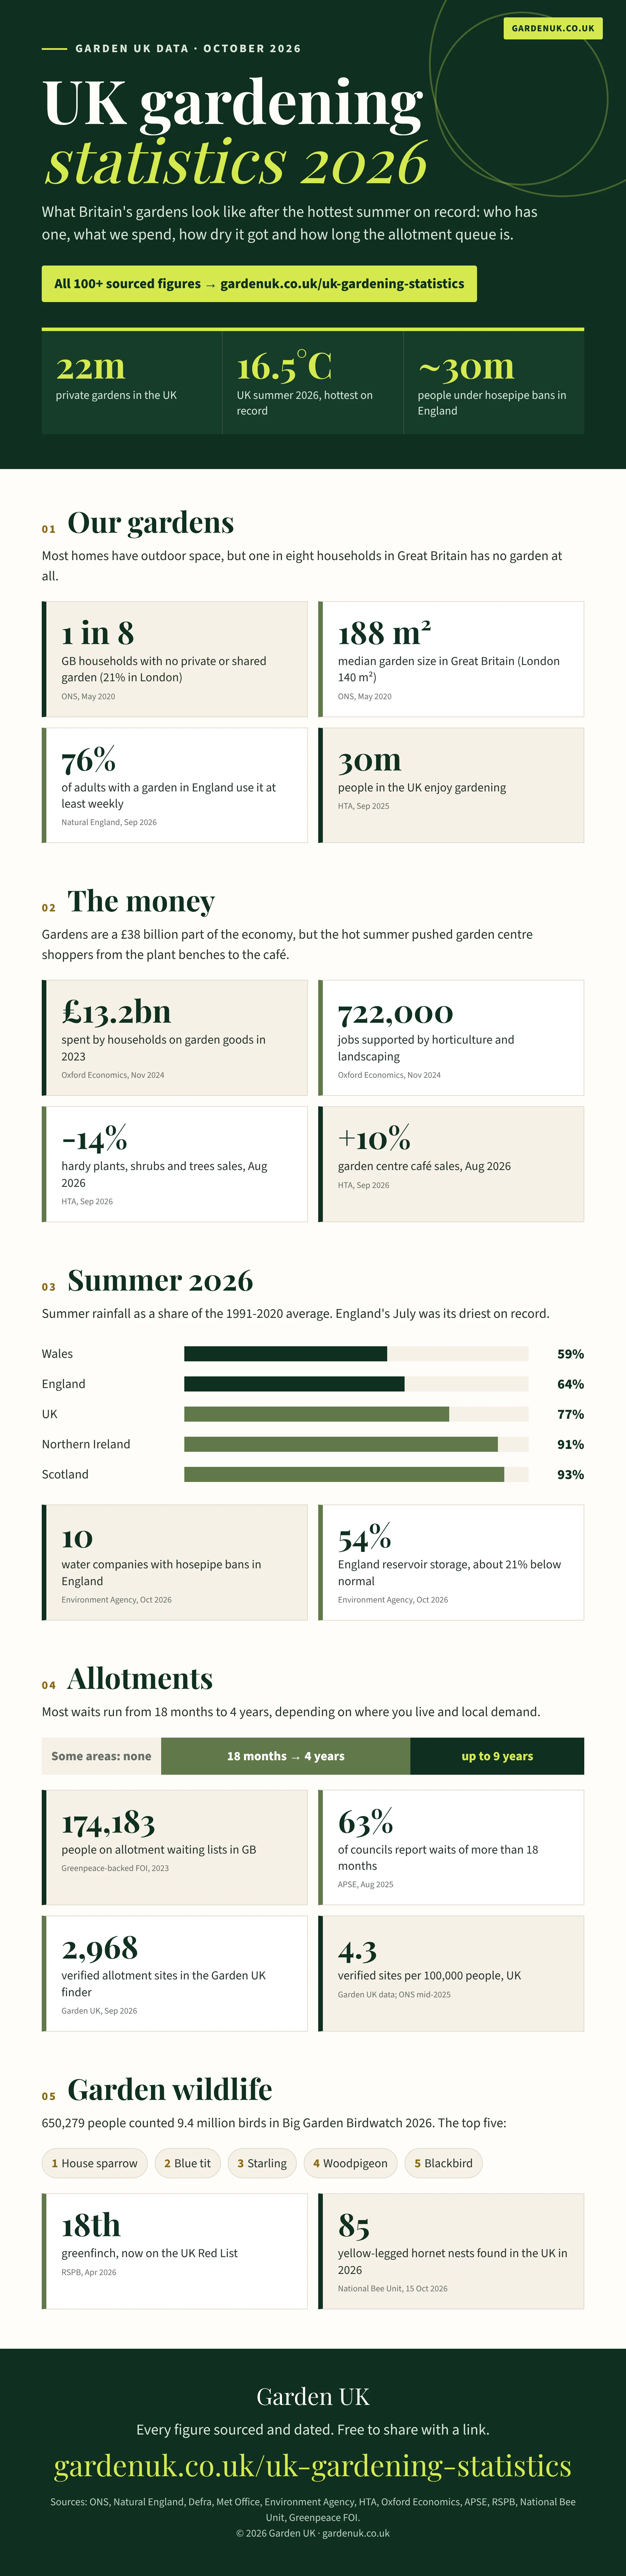
The key figures from this page in two shareable images. Download them, share them or add them to your own article. Please link back to this page when you use them.

What could change for UK gardeners in 2027?
Water is the biggest open question. The Environment Agency expects Devon and Cornwall and East Anglia to still be in drought in April 2027 even under its most likely scenario. There is about a one in four chance that half of England will be (National Drought Group, 16 Sep 2026).
Peat is the second. The retail ban promised for 2024 has not become law, so peat-free compost remains a choice rather than a rule in all four nations. Yellow-legged hornets are the third. The National Bee Unit logged 226 credible sightings and 85 nests by mid-October 2026, against 544 sightings and 161 nests in the whole of 2025.
The short version
Gardens matter to the UK economy and to people's health. Most households have one, they spend billions on them, and in England three quarters of adults with a garden use it every week. In 2026 the record heat and hosepipe bans held back plant sales, while garden centre cafés kept growing. Demand for allotments still outstrips supply, and the gap is widest in London.
Frequently asked questions
How many gardens are there in the UK?
There are about 22 million private gardens in the UK, according to the HTA (2025). The ONS found that 12% of households in Great Britain had no private or shared garden in 2020.
How much do UK households spend on gardening?
UK households spent £13.2 billion on garden goods in 2023, plus £5.8 billion on gardening and landscaping services (Oxford Economics, 2024).
How many people are affected by hosepipe bans in 2026?
About 30 million people in England were under hosepipe bans in autumn 2026, across ten water companies (Environment Agency, October 2026).
How long is the wait for an allotment in the UK?
Most waits run from 18 months to 4 years, depending on where you live and local demand. 63% of councils reported waits over 18 months in 2025 (APSE), and some, such as Haringey, average nine years.
Was summer 2026 the hottest on record in the UK?
Yes. The UK summer mean temperature was 16.5°C, the highest since records began, beating 16.1°C in 2025 (Met Office).
How we compiled these figures
- Primary sources first. We used official statistics wherever they exist, then trade bodies, charities and FOI studies where they do not. Each row names its source and publication date.
- Like with like. Some figures cover the UK, some Great Britain and some England only. The label says which.
- Known gaps. The ONS garden-access figures date from 2020 and are the latest official GB count. There is no official national series for allotment waiting lists. The HTA Value of Gardens report does not publish its method.
- Our own data. The allotment site table uses Garden UK's verified finder data. See the allotment data report for how sites were checked.
- Updates. Hosepipe ban and drought figures change weekly and are shown as at mid-October 2026. The whole page is reviewed each year. Next full review: October 2027.
Citing this page: "UK Gardening Statistics 2026", Garden UK, 2026-10-21, https://gardenuk.co.uk/uk-gardening-statistics/. Graphics and tables may be reused with a link to this page or to gardenuk.co.uk. Spotted an error or a newer figure? Email editor@gardenuk.co.uk.
Sources
Official statistics
- ONS, One in eight British households has no garden (14 May 2020)
- Natural England, People and Nature Survey: Adults Year 6 annual report (April 2025 to March 2026) (9 Sep 2026)
- Defra, England Biodiversity Indicators: households encouraging wildlife in their garden (Dec 2024)
- Defra, Horticulture statistics 2025 (25 Jun 2026)
- ONS, Population estimates for the UK, England, Wales, Scotland and Northern Ireland: mid-2025 (1 Oct 2026)
- ONS, Population and household estimates, England and Wales: Census 2021 (regional populations) (28 Jun 2022)
- National Records of Scotland, Scotland's Census 2022 (2023)
- NISRA, Census 2021 population estimates for Northern Ireland (2022)
Weather and water
- Met Office, Summer 2026 provisionally hottest on record for the UK (1 Sep 2026)
- Environment Agency, Dry weather and drought in England: 9 to 15 October 2026 (16 Oct 2026)
- Environment Agency, Dry weather and drought in England: 25 September to 1 October 2026 (2 Oct 2026)
- Defra and Environment Agency, National Drought Group press release (16 Sep 2026)
- Water company ban notices, compiled by Water Industry Hub (Oct 2026)
Industry and trade bodies
- Oxford Economics for the Environmental Horticulture Group, The economic impact of environmental horticulture and landscaping in the UK (Nov 2024)
- HTA, Value of Gardens report (25 Sep 2025)
- HTA, Market Update September 2026 (reviewing August 2026) (Sep 2026)
- HTA, survey of growers and garden centres on the peat ban (April 2023) (2023)
- Peat Free Partnership, Legislation timeline (Jan 2025 entry)
Allotments
- APSE (Association for Public Service Excellence), State of the Market on Allotments 2025 (Aug 2025)
- Sustain, report on Greenpeace-backed FOI research into allotment waiting lists (23 Oct 2023)
- Dino Decking, FOI study of UK council allotment waiting lists (175 councils) (14 Jul 2025)
- Garden UK, UK allotment data report 2026 (30 Sep 2026)
Wildlife
- RSPB, Big Garden Birdwatch 2026 results (10 Apr 2026)
- National Bee Unit, Yellow-legged hornet 2026 rolling update (15 Oct 2026)
- GB Non-native Species Secretariat, Yellow-legged hornet update (21 Nov 2025)